
Incoming item · UX Research
Ecommerce Quantitative UX: 3 High-Level Trends & Takeaways from 20+ Charts
Description
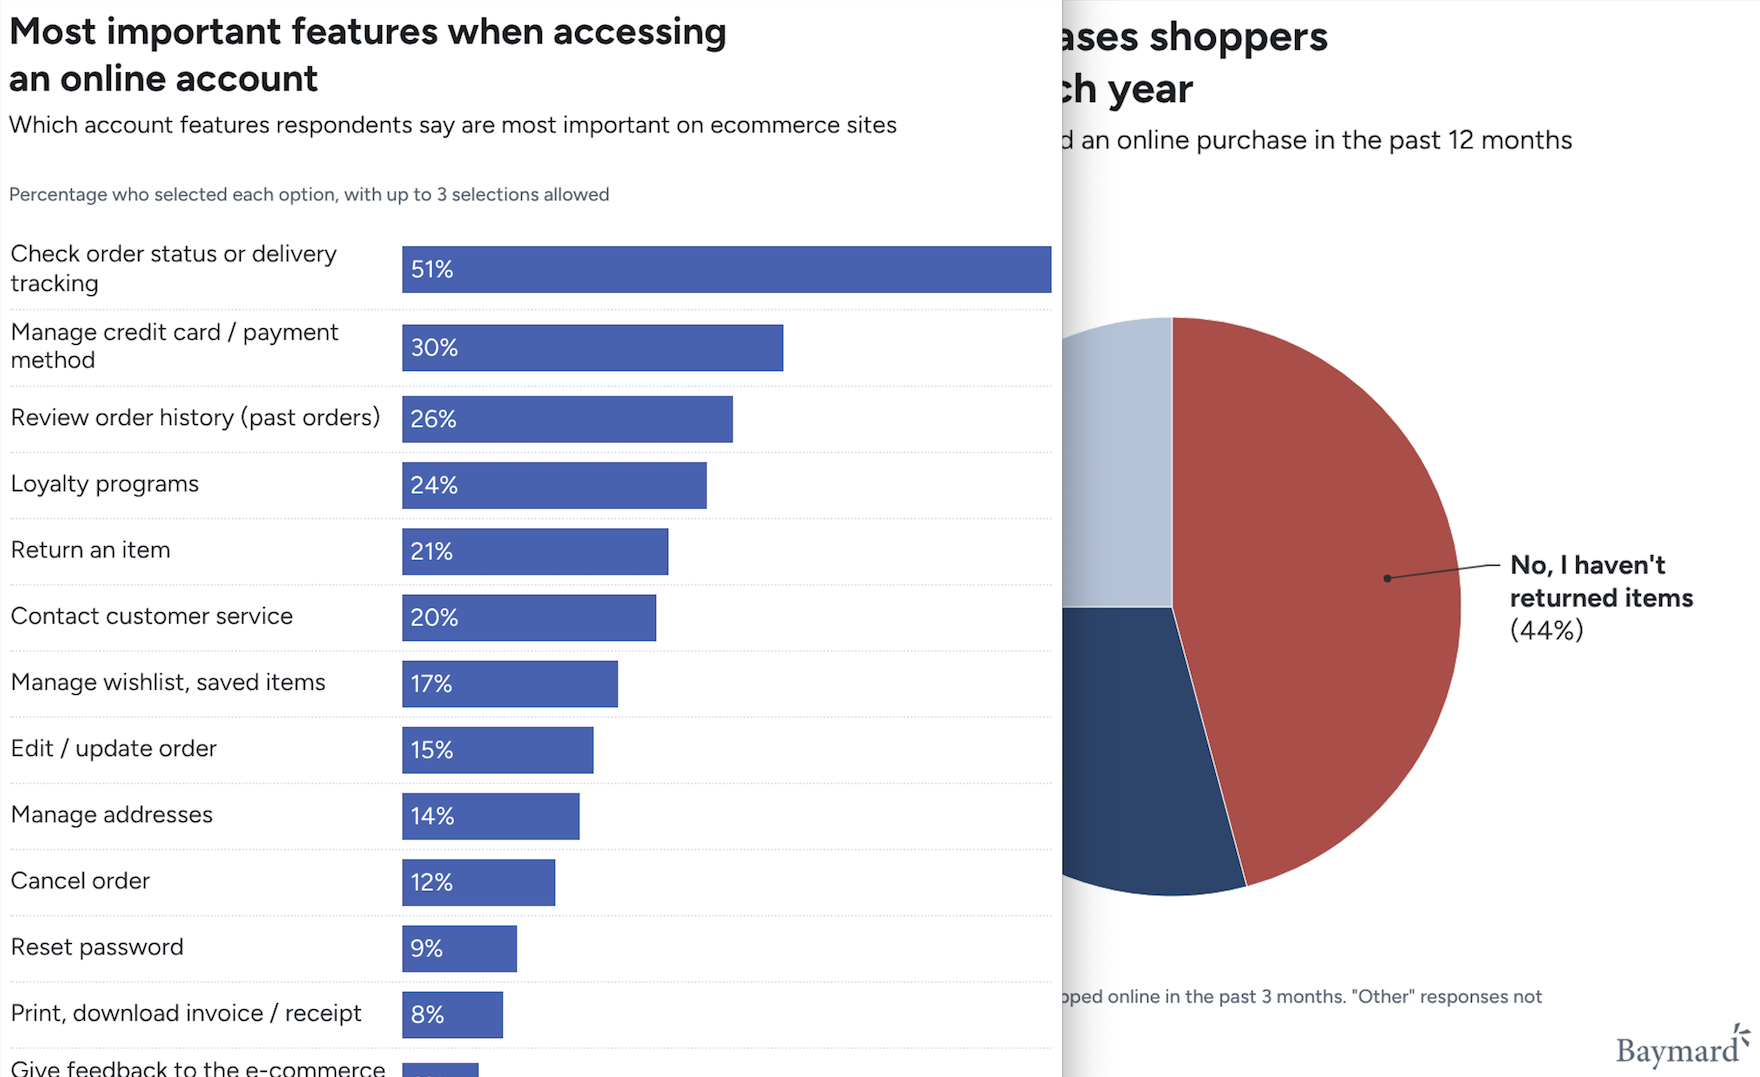
(Note: Unfortunately, e-mail and RSS don’t support advanced layouts and features. If the graphics in this article look strange, you may want to read the article in your web browser.) Key Stats & Takeaways 20+ new insights on general ecommerce shopper habits and preferences 1,083 US online shoppers surveyed in this quantitative UX study General ecommerce shopping habits remain consistent overall, but a few noteworthy shifts stand out this year, from declining return frequencies to changing newsletter preferences At Baymard, we’ve released updated Quantitative Insights into the habits and preferences of online shoppers across key ecommerce stages. These insights are survey-based data visualizations that complement and deepen our large-scale UX research findings . The 20+ insights cover the online shopping experience across a wide range of topics: product discovery, cross-sell preferences, sale-seeking behaviors, checkout friction, return behaviors, account feature expectations, and newsletter management. Ecommerce shoppers make decisions with deeply ingrained expectations regarding transparency, flexibility, and convenience, standards that continually evolve as the online shopping landscape evolves. While the vast majority of our foundational data remains highly stable year after year, tracking this data over time reveals a few subtle, critical shifts in reported consumer habits. Over the last 3 years, consumer habits show clear directional changes in how frequently shoppers make online returns for their past purchases. Further down the funnel, they frequently leverage accounts to manage post-purchase utility, carefully balancing their participation in brand incentive structures with their tolerance for direct retailer outreach. Each of these evolving dynamics plays out at a different stage of the user experience, highlighting exactly where optimization priorities should be re-evaluated. In this article, we’ll highlight 3 high-level findings that reflect the most
Score breakdown
Total score: 55/100
- Matches an include keyword (+50)
- Description is available (+5)